Image
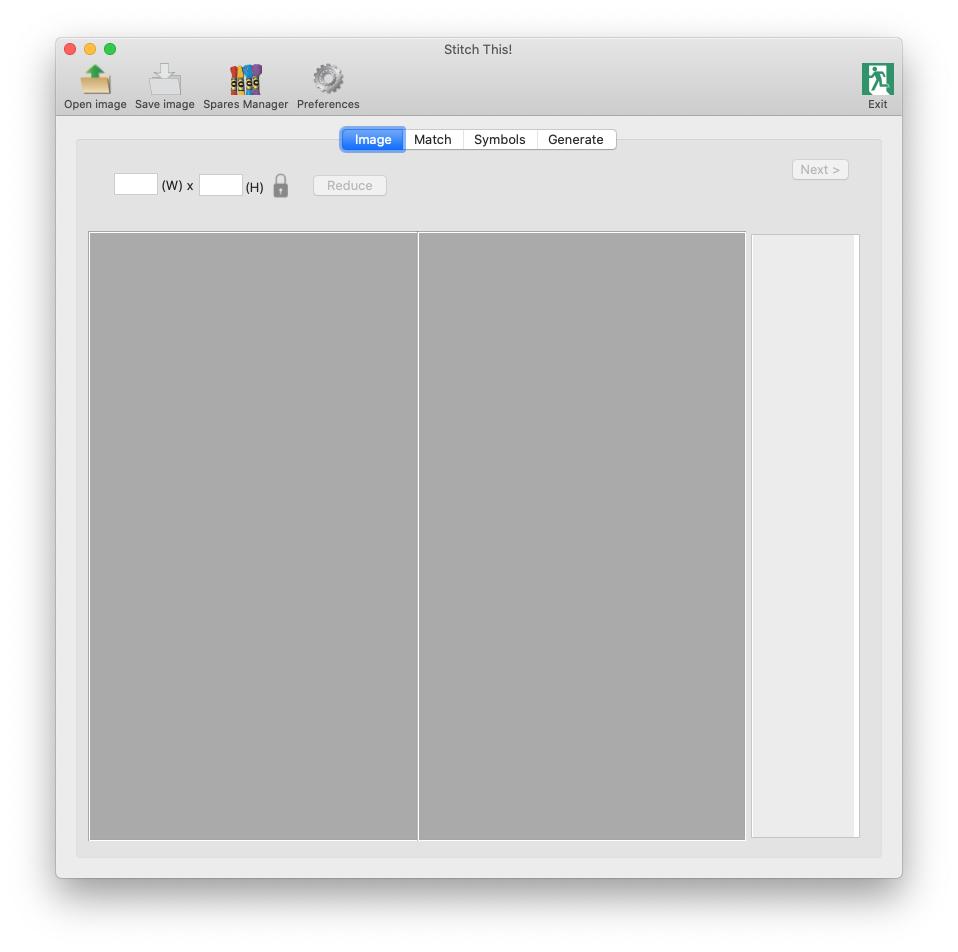
When you open the app, this is what you'll see:
Click on the Open image button in the toolbar, and load an image:
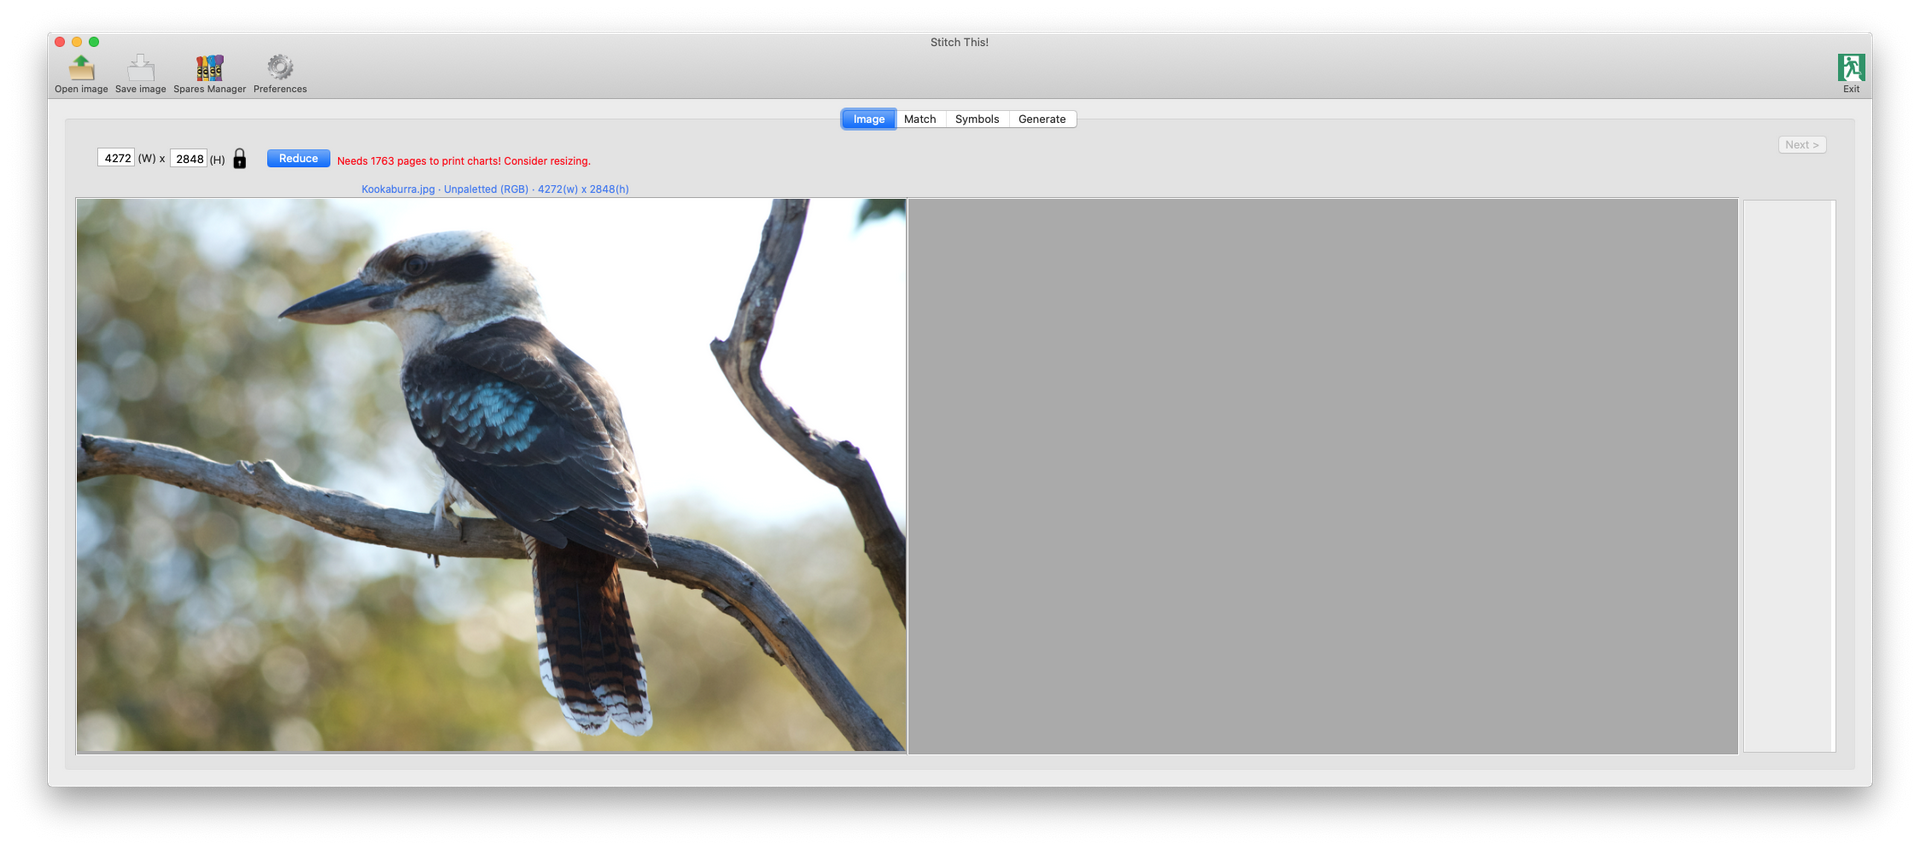
It will expand the app's window to the width or height of your screen, so that you can compare results in as much detail as possible. Note the warning in red in the illustration above, telling you that the image is too large to process without resizing.
Change one of the image's dimensions (if necessary) and press enter ( ↩ ) - this will automatically recalculate the other dimension (if the padlock icon is in the locked position), then click Reduce:
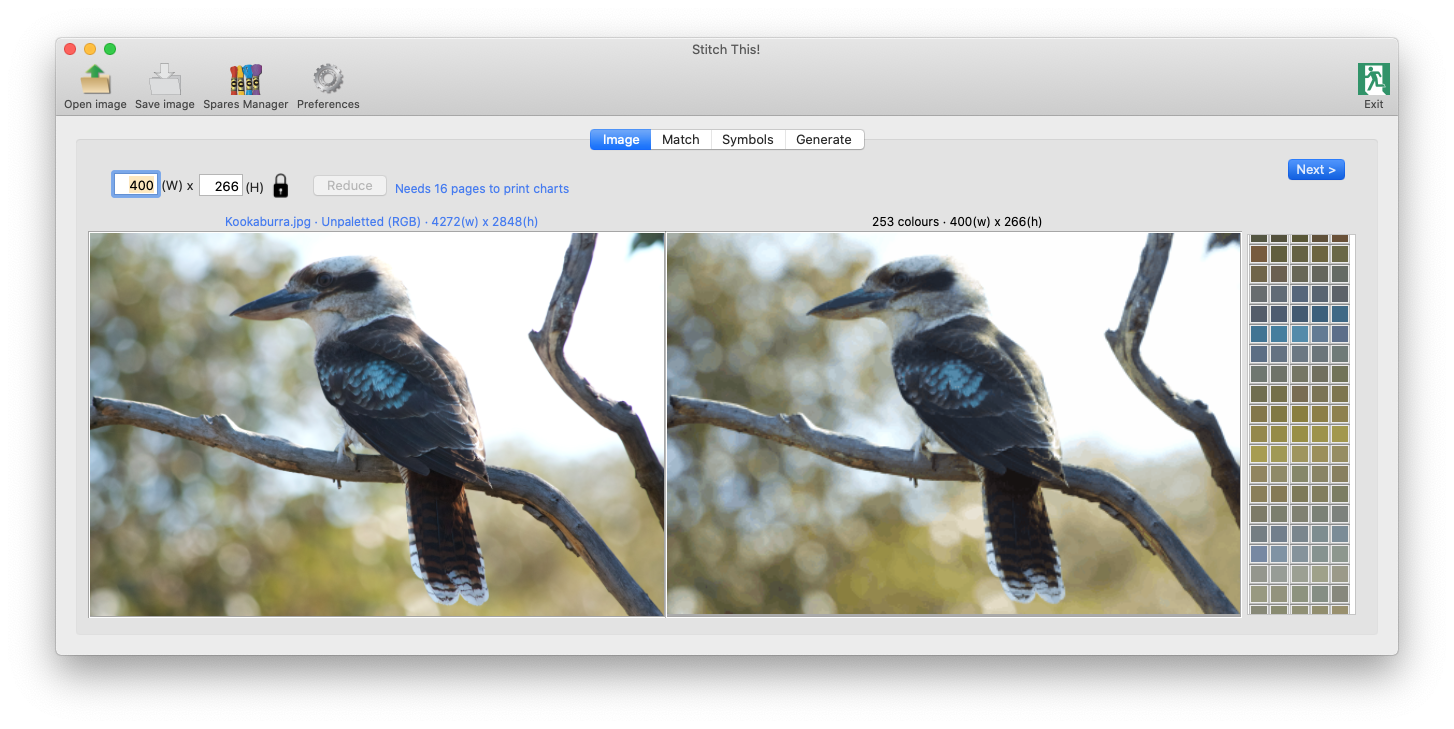
To the right, this will present you with the image reduced to those dimensions, and to 256 colours or less.
Please note that this will be displayed the same size as the original, thereby revealing any loss of detail created by reducing the size. The colour detail shouldn't normally be significantly different to the original in the left pane.
Beyond that it displays the palette of colours it has chosen.
A message appears alongside the Reduce button indicating how many pages of charts would be produced with the image at this size. If that is still too many, enter a new value and click Reduce again. This will have to be a compromise between the number of pages to work and the loss of image quality, as displayed to the right.
Once you're happy with your settings, you can proceed to the next step - either by selecting the Match option from the tab set at the top, or clicking the
Next >
button at the top right of the tab.